
Cost Comparison & ROI Analysis for Cattle Fencing
Data-driven comparison of installation cost, operating expense, and long-term return on investment for cattle fencing systems
Why Cost and ROI Matter in Fence Decisions
Choosing a cattle fencing system is a capital allocation decision with multi-decade consequences. The true economic impact extends far beyond the invoice for materials. Installation cost represents only the first entry in a long ledger that includes ongoing maintenance, labor hours, operational downtime, energy consumption, liability exposure, and ultimately the opportunity cost of capital tied up in infrastructure that may or may not deliver flexibility as operations evolve.
Total cost of ownership analysis reveals that fencing systems differ not just in upfront price but in their cost structure over time. High initial investment with minimal ongoing expense produces a different financial profile than low initial cost with recurring maintenance demands. Understanding this distinction allows ranch operators to match fencing decisions to cash flow patterns, labor availability, and operational priorities rather than defaulting to familiar options that may no longer represent optimal allocation of resources.
The difference between lowest price and lowest cost becomes clear when examining real-world scenarios. A fence that costs less to install but requires frequent repair diverts labor from revenue-generating activities, creates unpredictable expense timing, and introduces operational risk through containment failures. Conversely, systems with higher upfront costs but predictable, minimal ongoing requirements provide budget certainty and free management attention for strategic rather than reactive work.
The Hidden Cost Structure
Traditional cost analysis focuses on visible line items while overlooking costs that never appear on invoices but directly impact profitability. These hidden costs accumulate silently and often exceed documented expenses over the life of the infrastructure. Escaped livestock generates direct costs through recovery time, potential injury to animals, crop damage to neighbors, and liability exposure from roadway accidents. In closed-range jurisdictions or areas near highways, a single escape incident can result in legal liability ranging from property damage claims to serious accident-related costs.
Operational downtime during fence failure creates cascading effects. Rotational grazing schedules disrupted by broken fences reduce forage utilization efficiency and force cattle onto paddocks not yet ready for grazing or that should be resting. Emergency repairs consume labor hours during peak seasons when that time carries highest opportunity cost. The unpredictability of traditional fence failures makes scheduling difficult and forces operations into reactive rather than proactive management modes.
Labor allocation represents another hidden cost dimension. Time spent walking fence lines, splicing broken wires, resetting posts, and retensioning sagging strands diverts skilled labor from higher-value activities. On operations where labor is the constraining resource, fence maintenance competes directly with breeding decisions, health monitoring, forage management, and marketing activities that directly influence revenue. The true cost of fence maintenance includes not just the hourly rate paid but the revenue foregone from activities that maintenance time displaces.
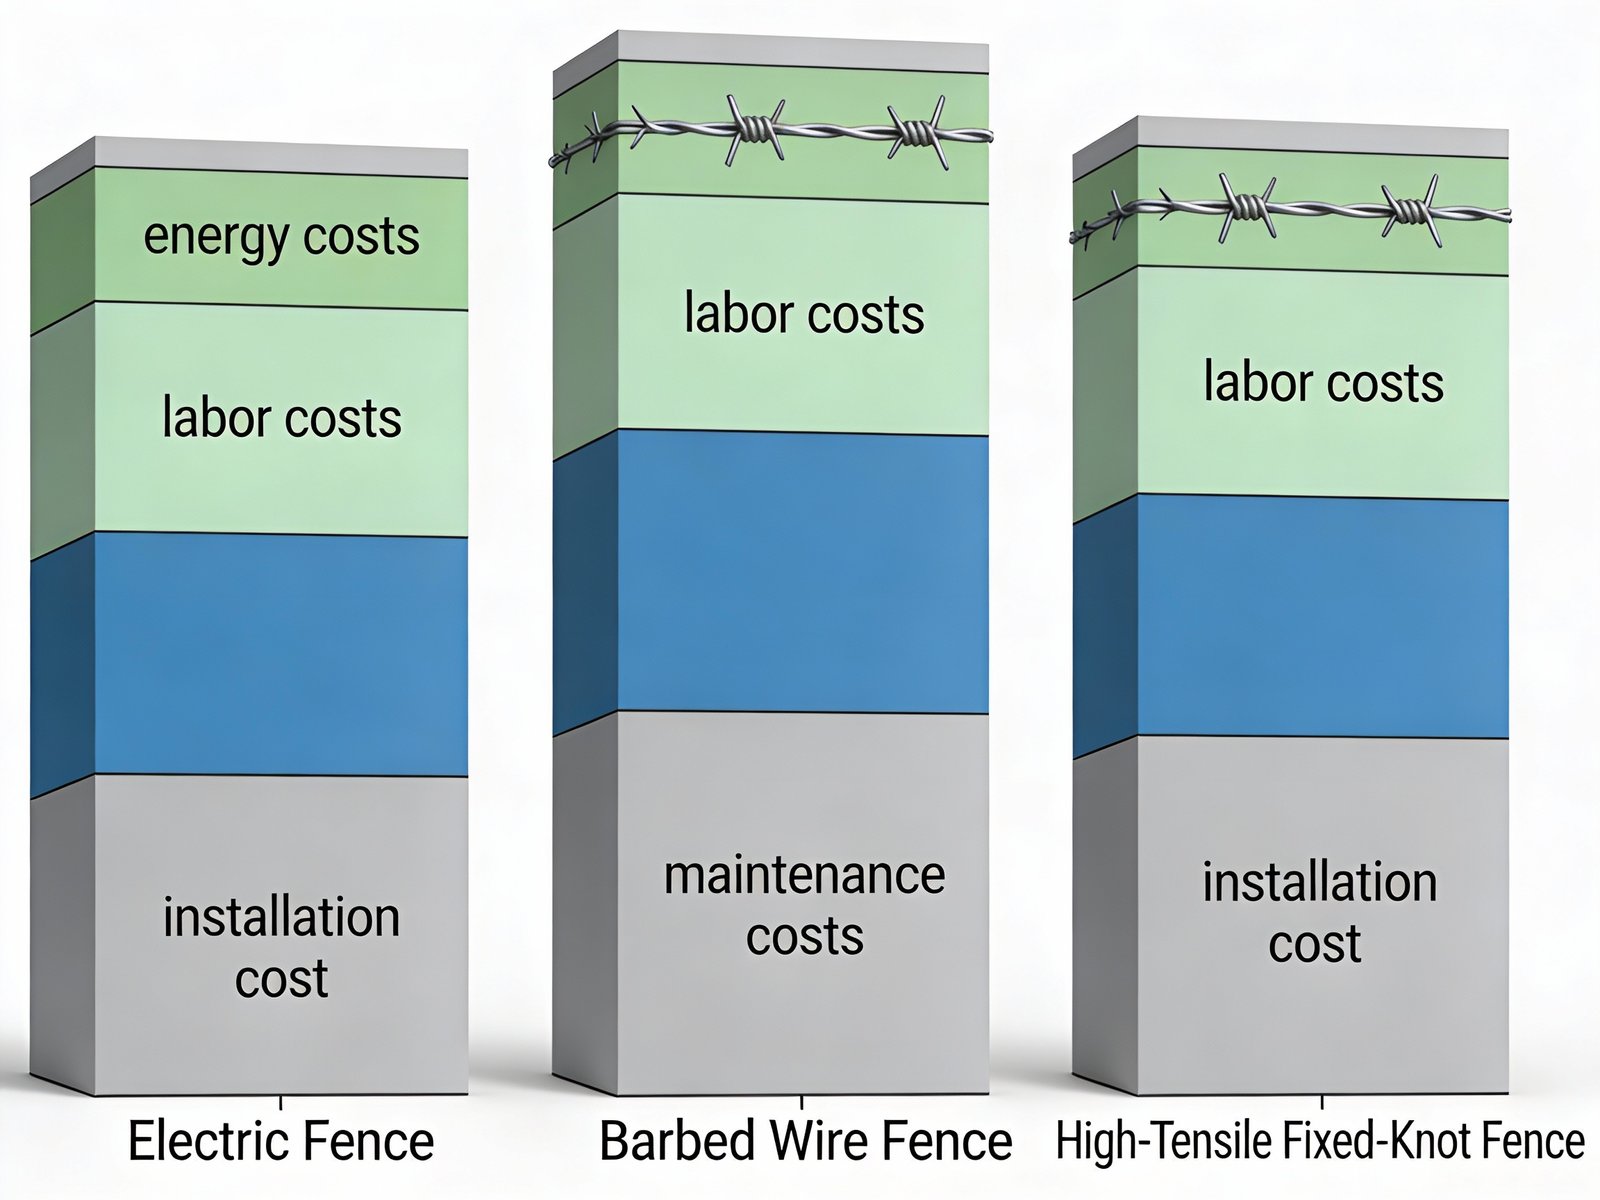
Initial Installation Cost Comparison
Installation costs represent the capital outlay required to establish functional fencing infrastructure. These figures incorporate materials, hardware, posts, gates, corner assemblies, and installation labor based on typical contractor rates in U.S. cattle regions. Terrain, soil conditions, accessibility, and regional labor markets introduce variability, but the relative cost relationships remain consistent across most operating environments.
The gap between lowest-cost and highest-cost options narrows considerably when installation is amortized over realistic service life. Systems with higher upfront costs but longer lifespans often deliver lower annualized capital costs than cheaper alternatives requiring frequent replacement. The relevant comparison metric is cost per mile per year of service, not simply cost per mile installed.
| Fence Type | Cost per Foot | Total Cost per Mile | Expected Lifespan | Annual Cost per Mile |
|---|---|---|---|---|
| Electric Fence (Permanent) | $0.25–$1.00 | $500–$5,000 (avg. $1,300) | 10–20 years | $65–$130 (avg. $87) |
| Barbed Wire Fence | $2.50–$6.00 | $13,200–$31,735 (avg. $25,000) | 15 years | $880–$2,116 (avg. $1,667) |
| High-Tensile Wire (Non-Electric) | $4.00–$6.70 | $21,000–$35,400 (avg. $28,000) | 10 years | $2,100–$3,540 (avg. $2,800) |
| Fixed-Knot High-Tensile (Class III Galvanized) | $5.00–$6.60 | $26,400–$35,000 (avg. $31,000) | 30–40 years | $660–$1,167 (avg. $880) |
| Temporary Electric Fence (Polywire) | $0.25–$0.60 | $1,320–$3,168 (materials only) | 3–5 years | $264–$1,056 |
Understanding Cost per Mile Calculations
Cost per mile figures assume standard agricultural fencing specifications appropriate for mature beef cattle. Barbed wire costs reflect 4–5 strand configurations with T-posts spaced 10–12 feet and corner assemblies every quarter mile. High-tensile specifications include 5–7 strands with posts spaced 15–24 feet depending on wire gauge and tension specifications. Electric fence costs assume 3–5 hot wires with lightweight posts, insulators, and proportional share of energizer systems amortized across typical ranch-scale installations.
Installation labor typically represents 50–70% of total project costs for traditional fencing and 40–60% for electric systems. This labor intensity means that DIY installation can reduce costs by 40–50%, but only if internal labor capacity exists and opportunity cost of that labor is properly evaluated. Contractor installation provides expertise in proper corner bracing, wire tensioning, and compliance with structural requirements that directly affect long-term performance and maintenance requirements.
Operating and Maintenance Costs
Energy Cost for Electric Fencing
Electric fencing systems consume minimal electricity, making energy costs nearly negligible in total cost of ownership analysis. A typical low-impedance energizer rated at 4.5 watts operating continuously year-round consumes approximately 39.4 kilowatt-hours annually. At average U.S. agricultural electricity rates of $0.23 per kWh, annual energy cost totals approximately $9 per year regardless of total fence miles powered. Even larger energizers rated at 10–15 watts for extensive systems rarely exceed $25 annual energy costs.
Solar-powered energizers eliminate even this minimal operating cost, though they carry higher initial capital costs ($300–$600 for quality solar units versus $150–$350 for AC-powered equivalents). For remote locations without grid access, solar power eliminates trenching and electrical service extension costs that can exceed $3,000–$10,000 per mile, making solar economically superior despite higher energizer costs. Battery backup systems add $50–$150 to initial costs and require battery replacement every 3–5 years at $30–$80 per battery.
Maintenance and Labor Requirements
Maintenance demands vary dramatically between fencing systems, creating cost structures with fundamentally different profiles. Traditional fixed fences require physical repair work when failures occur, while electric systems shift maintenance emphasis to monitoring, vegetation control, and periodic component inspection. The labor hours required and the predictability of that labor create distinct operational characteristics that affect both costs and management requirements.
Barbed wire fencing requires ongoing maintenance to address wire breakage from animal pressure, post deterioration, staple failure, and tension loss. Industry surveys indicate typical annual maintenance requirements of 10–20 labor hours per mile for perimeter fences and 15–25 hours per mile for high-pressure interior fences containing bulls or frequently rotated cattle. At $20–$25 per hour for skilled ranch labor, this translates to $200–$625 annual labor cost per mile, with additional materials costs for wire splices, staples, posts, and bracing repairs averaging $50–$150 per mile annually.
Electric fencing maintenance focuses on vegetation management, insulator integrity, and connection point inspection rather than physical repairs. Properly installed systems require 4–8 annual labor hours per mile for vegetation trimming along wire paths and visual inspection of posts and insulators. Vegetation contact creates power leakage that reduces shock effectiveness, making vegetation control the primary maintenance activity. Annual materials costs remain minimal at $10–$30 per mile for occasional insulator replacement and connection point maintenance. The key distinction is maintenance predictability rather than total hours, as electric fence maintenance can be scheduled during low-workload periods while traditional fence repairs occur reactively when failures happen, often during busy seasons.
Hidden Labor Costs and Operational Disruption
The true cost of fence maintenance extends beyond direct repair hours to include containment failure costs, disrupted management schedules, and opportunity costs from displaced activities. Traditional fence failures typically occur without warning, forcing immediate response to contain escaped animals and execute emergency repairs. A single cattle escape incident consumes 2–6 labor hours for animal recovery depending on terrain and herd behavior, with additional hours for temporary containment and permanent repair.
Liability exposure from escaped livestock represents a significant but often unquantified cost component. In closed-range jurisdictions and areas adjacent to public roadways, livestock owners bear legal responsibility for damages caused by escaped animals. Property damage to neighbors’ crops, vehicle collisions, and personal injury incidents can generate claims ranging from hundreds to hundreds of thousands of dollars. While liability insurance provides financial protection, premiums reflect claims history, and deductibles typically range from $500–$2,500 per incident. Documented fence maintenance practices and rapid response to known issues become critical factors in liability defense.
Rotational grazing operations experience additional costs when fence failures disrupt planned grazing sequences. Cattle moved into paddocks before adequate forage recovery reduces future carrying capacity and may force early weaning or supplemental feeding. Extended grazing periods on paddocks waiting for fence repairs causes overgrazing that requires full growing seasons to recover. These impacts rarely appear in cost accounting systems but directly reduce pounds of beef produced per acre, which is the ultimate measure of grazing system efficiency.
Total Cost of Ownership Over Time
Total cost of ownership integrates installation capital, maintenance expenses, labor requirements, energy consumption, and replacement cycles over a defined planning horizon. The appropriate planning horizon for fencing decisions is 30 years, representing typical ranch operator tenure and matching the service life of longest-lasting fencing options. Shorter planning horizons favor low-initial-cost options regardless of ongoing expenses, while longer horizons reveal the cumulative burden of high-maintenance systems.
A comprehensive 30-year TCO analysis comparing major fencing systems reveals dramatic differences in cumulative costs and identifies the time points at which higher initial investment is recovered through lower ongoing expenses. These calculations assume one mile of fence for direct comparison, with costs scaled proportionally for longer installations.
30-Year Cost Analysis: Electric Fence
Electric fence total cost over 30 years includes approximately two complete system replacements (given 10–20 year lifespan with average of 15 years), ongoing vegetation management labor, minimal materials for repairs, and energy costs. Total installation and replacement costs over 30 years: $2,600 (two full installations at average $1,300 each). Annual maintenance labor of 6 hours at $22.50/hour totals $135/year or $4,050 over 30 years, with materials adding $20/year ($600 total). Energy costs of $9/year total $270 over 30 years. Cumulative 30-year cost: $7,520 per mile, or $251 per mile per year.
30-Year Cost Analysis: Barbed Wire Fence
Barbed wire systems require two complete replacements over 30 years given 15-year typical lifespan. Installation costs: $50,000 (two installations at $25,000 average). Annual maintenance labor of 15 hours at $22.50/hour equals $337.50/year ($10,125 total), plus materials at $100/year ($3,000 total). Additional costs include periodic major repairs for corner posts and brace assemblies averaging $150/year ($4,500 total). Total 30-year cost: $67,625 per mile, or $2,254 per mile per year. This represents 8.9 times the annual cost of electric fencing.
30-Year Cost Analysis: Fixed-Knot High-Tensile Fence
Class III galvanized high-tensile fixed-knot fencing with proper installation achieves 30–40 year service life, requiring only one installation over the planning horizon. Installation cost: $31,000. Annual maintenance labor of 8 hours at $22.50/hour totals $180/year ($5,400 over 30 years), with minimal materials at $25/year ($750 total). Corner assemblies may require one mid-life rebuild at approximately $800. Total 30-year cost: $37,950 per mile, or $1,265 per mile per year. While substantially more expensive than electric fencing, high-tensile systems deliver lowest cost among physical barrier options and provide permanent boundary definition.
Cost Structure Implications for Decision Making
The cost structure of each system creates different cash flow patterns and risk profiles. Electric fencing requires minimal initial capital and spreads costs evenly over time through predictable maintenance activities, matching well with operations that have limited capital but adequate labor. Traditional fencing systems require significant capital commitments upfront with unpredictable maintenance expenses creating budget variability. High-tensile systems require largest initial capital but deliver most predictable ongoing costs with lowest labor demands.
These structural differences mean optimal choices vary with operation characteristics. Capital-constrained operations benefit from electric fencing’s low initial cost and can absorb predictable maintenance labor from existing workforce. Operations with capital availability but limited skilled labor benefit from high-tensile’s one-time installation cost and minimal ongoing demands. Barbed wire’s moderate initial cost and high ongoing expenses create the worst profile for most scenarios, explaining its declining use despite historical prevalence.
ROI Analysis: When Electric Fencing Delivers Fastest Returns
Return on investment analysis for fencing examines how quickly capital deployed in fencing infrastructure generates returns through operational improvements, cost avoidance, and enhanced productivity. Unlike revenue-generating investments, fencing delivers returns primarily through cost reduction and risk mitigation, making ROI calculation less direct but no less important. The relevant comparison is not whether fencing generates positive returns but which fencing system delivers superior returns relative to capital deployed.
Electric fencing consistently delivers fastest ROI through combination of lowest capital requirement, minimal ongoing costs, and enhanced operational capabilities. An operation replacing 10 miles of failing barbed wire fence faces $250,000 capital outlay for traditional replacement versus $13,000 for electric alternative. The $237,000 capital difference invested elsewhere in the operation (cattle purchases, equipment upgrades, land acquisition) while still achieving equivalent or superior animal containment represents immediate return through capital redeployment to higher-return uses.
ROI Through Reduced Operating Costs
Annual operating cost savings compound over time to create substantial cumulative returns. An operation maintaining 20 miles of barbed wire fencing averaging $2,254 per mile annually ($45,080 total) can reduce this to approximately $5,020 annually with electric fencing conversion, generating $40,060 annual savings. Over 10 years, cumulative savings of $400,600 dramatically exceed the $260,000 conversion cost difference, delivering simple payback in approximately 6.5 years and strong positive returns thereafter.
Labor savings drive significant ROI components. Reducing fence maintenance from 15 hours per mile annually to 6 hours per mile for 20-mile system saves 180 labor hours per year. At $22.50 per hour, this equals $4,050 annual direct labor savings, but opportunity cost typically exceeds wage rates. Those 180 hours redirected to herd health monitoring, breeding decisions, marketing activities, or forage management generate returns substantially higher than hourly wage rates, though precisely quantifying opportunity cost requires operation-specific analysis.
ROI Through Enhanced Operational Capabilities
Electric fencing enables management practices that improve revenue per acre beyond simple cost reduction. Rotational grazing systems using electric subdivision demonstrate 15–35% increases in carrying capacity through improved forage utilization and extended grazing seasons. On a 500-acre operation carrying 100 head of cattle, a 20% carrying capacity increase supports 20 additional head generating approximately $16,000–$24,000 additional annual gross revenue depending on enterprise type and market conditions.
The capital cost to achieve this productivity increase through electric fencing subdivision is approximately $15,000–$25,000 for complete internal fencing system with energizer, posts, wire, and installation labor. First-year gross revenue increase of $16,000–$24,000 approaches or exceeds total investment cost, delivering exceptional first-year returns. Subsequent years generate same revenue increase with only maintenance costs of $1,500–$2,500 annually, producing strong ongoing returns on initially deployed capital.
Feed cost reduction through rotational grazing provides additional ROI. Operations reducing supplemental feed requirements by 20–30% during grazing season through improved forage utilization save $50–$100 per head annually. For 100-head operation, this represents $5,000–$10,000 annual savings that continues as long as improved grazing management persists. These savings flow directly to operating margin and accumulate year after year following initial fencing investment.
Video: Electric Fence vs Barbed Wire Cost Comparison
Dallas Mount, CEO of Ranch Management Consultants, compares four-strand barbed wire fence costing approximately $21,000 per mile in materials versus single-strand high-tensile electric fence at $600 per mile. The 97% material cost reduction demonstrates how capital efficiency in fencing allows redeployment of savings to higher-return investments elsewhere in the operation. Properly constructed electric fence with adequate energizer and trained livestock provides equivalent or superior containment at fraction of traditional cost, fundamentally changing the economics of paddock subdivision and rotational grazing implementation.
ROI Scenarios Where Electric Fencing Excels
- Rotational grazing systems: Low capital cost enables extensive subdivision creating numerous paddocks for intensive management. Flexibility to adjust paddock sizes seasonally optimizes forage utilization across varying growth rates and herd sizes.
- Large acreage with internal subdivision needs: Operations requiring 20+ miles of internal fencing see dramatic capital savings. The cost difference between electric and traditional fencing for extensive internal systems often equals or exceeds the value of additional cattle that improved management supports.
- Operations prioritizing flexibility: Temporary and semi-permanent electric systems allow rapid configuration changes as management priorities evolve, enterprise mixes shift, or land use patterns change. This adaptability protects against obsolescence of fixed infrastructure.
- Labor-constrained operations: Minimal maintenance requirements free limited labor for revenue-generating activities rather than reactive fence repair. Predictable maintenance timing allows scheduling during low-workload periods.
- Capital-constrained expansion: Operations expanding acreage or increasing cattle numbers can implement electric fencing immediately with available capital rather than delaying for traditional fencing budget accumulation. Earlier implementation means earlier revenue generation from expanded operations.
When Traditional Fencing May Show Competitive Returns
High-tensile fixed-knot fencing delivers competitive long-term returns in specific scenarios despite higher initial costs. Permanent boundary fences in high-liability locations adjacent to public roads or neighboring crops justify premium for non-psychological barrier that functions regardless of power availability. Perimeter security where wildlife exclusion, predator deterrence, or public access control drives decisions may require physical barrier characteristics that electric systems cannot provide.
Operations with abundant capital, minimal labor constraints, and permanent land tenure spanning decades may find high-tensile’s 30–40 year lifespan and minimal maintenance attractive despite higher initial cost. The key discriminator is whether operation-specific factors create value from physical barrier characteristics that justify the substantial cost premium over electric alternatives.
Choosing the Right Fence Based on ROI
Optimal fencing decisions integrate capital availability, labor constraints, operational priorities, liability considerations, and management flexibility needs rather than defaulting to lowest initial cost or most familiar option. Different operational contexts favor different solutions, and many operations achieve best results through hybrid approaches combining multiple fence types matched to specific applications.
Capital Budgeting Framework for Fencing Decisions
Fencing decisions should follow structured capital budgeting methodology rather than intuitive selection. Begin by defining functional requirements: containment reliability, liability protection needs, flexibility requirements, planning horizon, and operational management approach. Quantify capital availability and compare required initial investment against available funds and alternative uses for that capital.
Calculate total cost of ownership over realistic planning horizon, incorporating all cost components: installation, maintenance labor at fully loaded rates including opportunity cost, materials, energy, expected lifespan, and replacement timing. Compare annual average costs across alternatives to identify lowest-cost option over planning horizon. For operations with capital constraints, evaluate financing options or phased implementation approaches that spread costs over time while still achieving operational objectives.
Assess operational benefits beyond cost reduction. Enhanced management capabilities through rotational grazing, improved forage utilization, extended grazing seasons, and increased carrying capacity generate revenue increases that should be quantified and incorporated in ROI analysis. Operations implementing comprehensive management changes enabled by electric fencing infrastructure should attribute appropriate portion of resulting productivity gains to fencing investment that made management changes possible.
Decision Matrix by Operation Type
Cow-calf operations with 300+ acres: Hybrid system with high-tensile perimeter and electric internal subdivision. Enables seasonal herd movement, rotational grazing, and separation of cow-calf pairs from replacement heifers or bulls. Total investment approximately $25,000–$45,000 for typical 500-acre operation with excellent long-term returns through productivity increases.
Stocker operations on rented ground: All electric, designed for easy removal and redeployment. Minimizes capital tied to temporary locations while providing adequate containment. Focus on portable polywire systems and temporary posts. Investment $8,000–$15,000 for 300-acre operation with complete recovery of equipment value when moving to new ground.
Small acreage intensive operations: Electric throughout with emphasis on frequent rotation. Low capital cost enables experimentation with optimal paddock sizes and grazing intervals without excessive infrastructure commitment. Investment $3,000–$8,000 for complete 40–80 acre system.
Large ranch operations 2,000+ acres: Hybrid with permanent high-tensile for major boundaries and pasture divisions, electric for intensive management areas and flexible subdivision within large pastures. Phased implementation over multiple years spreads capital requirements. Total investment $150,000–$300,000 for comprehensive system with multi-decade planning horizon and strong cumulative returns through labor savings and productivity gains.
Frequently Asked Questions
Is electric fencing really cheaper long-term?
Yes, when all cost components are properly accounted over realistic planning horizons. Electric fencing delivers approximately 89% total cost savings versus barbed wire and 80% savings versus high-tensile over 30-year period when installation, maintenance, labor, and energy costs are integrated. The savings result from dramatically lower initial capital, minimal materials costs for ongoing maintenance, reduced labor hours, and predictable expense timing. The cost advantage is largest for operations with extensive internal fencing requirements where miles of fence generate compounding savings. For single-mile perimeter applications, cost differences remain substantial but represent smaller absolute dollar savings.
Why do some ranches still choose barbed wire despite higher long-term costs?
Barbed wire remains common primarily due to familiarity, historical precedent, and institutional inertia rather than economic optimization. Many operators replicate fencing approaches learned from previous generations without systematic cost analysis. Barbed wire’s physical presence provides psychological comfort that containment will persist even with neglected maintenance, while electric systems require ongoing monitoring to ensure power delivery. Some operators overestimate electric fence complexity and underestimate long-term traditional fence costs. Additionally, lending institutions and appraisers may value traditional fencing higher than electric systems when assessing ranch value, creating perverse incentive favoring higher-cost option. As younger operators trained in financial analysis and systems thinking enter ranching, and as electric fence installation knowledge becomes more widespread, economic fundamentals increasingly drive decisions toward lower-cost electric alternatives.
Can electric fencing replace traditional fencing completely?
Complete replacement is technically feasible and economically optimal for many operations, but hybrid approaches often deliver superior results by matching fence type to specific application requirements. Electric fencing provides effective containment for trained cattle in most scenarios, but perimeter boundaries benefit from physical barriers in high-liability locations adjacent to roads, where neighbor relations favor permanent visible boundaries, or where power reliability concerns exist. Internal subdivision, rotational grazing paddocks, and temporary fencing applications strongly favor electric systems. Most operations achieve best outcomes using permanent physical fencing for primary perimeter with electric systems for all internal management, combining security and flexibility while optimizing total system costs.
How long does it take to recover the investment in electric fencing?
Payback period varies with specific application but typically ranges from 3–7 years when replacing traditional fencing, and immediate to 2 years when enabling operational improvements. Direct cost savings from replacing barbed wire with electric systems generate payback in 5–7 years through reduced maintenance and labor costs alone. When productivity improvements from enhanced rotational grazing are included, payback accelerates to 2–4 years. For operations implementing electric fencing on previously unfenced areas to enable grazing management improvements, increased carrying capacity and reduced feed costs often generate returns exceeding investment cost within first year. The fastest payback occurs when electric fencing enables enterprise changes such as shifting from continuous grazing to intensive rotational systems, where productivity gains are largest.
What are the main risks or disadvantages of electric fencing?
Primary risks involve power delivery reliability and cattle training requirements. Electric systems provide psychological rather than physical barriers, meaning effectiveness depends on continuous power delivery and animal respect for the fence. Power outages, energizer failures, vegetation shorting, or inadequate grounding create windows where containment may fail. These risks are manageable through proper system design, backup power sources, routine monitoring, and redundant containment (perimeter physical fence backing up internal electric). Cattle training requires initial time investment and occasional retraining, particularly with replacement animals unfamiliar with electric fence. Some operations find monitoring requirements and training needs outweigh cost savings, but systematic analysis usually reveals properly implemented electric systems deliver superior economics even accounting for additional management attention.
How does weather affect different fencing systems’ costs?
Weather impacts vary by system type. Traditional fencing suffers physical damage from falling trees, snow loading, freeze-thaw post heaving, and wind stress, generating unpredictable repair costs concentrated in post-storm periods. Electric systems experience reduced effectiveness during wet conditions when cattle ground contact improves and during droughts when dry soil increases grounding resistance, but these effects reduce shock intensity rather than causing physical damage. Snow and ice can short wires to ground or posts, requiring temporary power adjustments. Properly designed electric systems with adequate joule output and correct grounding handle weather variations without failure. High-tensile fencing shows best weather resistance, with Class III galvanization protecting against corrosion and high wire tension preventing sag even under snow load. Climate-specific design considerations affect optimal choices, but cost relationships remain generally consistent across regions.
Key Cost & ROI Takeaways
Key Economic Principles
- Total cost of ownership over 30-year planning horizon is the appropriate decision metric, not initial installation cost. Systems with lowest upfront costs often carry highest cumulative expenses through maintenance, labor, and replacement cycles.
- Hidden costs including labor opportunity cost, operational disruption, liability exposure, and foregone management capabilities often exceed visible line-item expenses in traditional fencing cost structures.
- Electric fencing delivers fastest ROI through combination of minimal capital requirements, lowest ongoing costs, and enhanced operational capabilities enabling productivity improvements through intensive grazing management.
- Hybrid fencing systems matching fence type to specific applications provide optimal balance of cost, security, flexibility, and risk management for most comprehensive ranch-scale implementations.
- Decision framework should follow structured capital budgeting methodology incorporating functional requirements, capital constraints, total cost of ownership analysis, operational benefits quantification, and operation-specific factors rather than defaulting to familiar or traditional approaches.
Implementation Guidance
Operations evaluating fencing investments should begin with comprehensive cost modeling comparing total 30-year ownership costs across alternatives using operation-specific labor rates, maintenance assumptions, and capital costs. Quantify operational benefits from improved management capabilities and incorporate into ROI analysis. Consider hybrid approaches matching permanent physical fencing to perimeter and high-liability applications while deploying electric systems for internal subdivision and rotational management. Evaluate phased implementation spreading capital requirements over multiple years while delivering operational improvements incrementally. Engage experienced installers for permanent systems to ensure proper design and construction affecting long-term performance and maintenance requirements.
For comprehensive guidance on system design and installation, see our detailed resources on energizer selection, installation methodology, and ongoing maintenance requirements. Operations ready to implement fencing projects can explore our fencing products or contact our team for operation-specific consultation.